
Have we quietly reached a point where where people must move because the places they once called home stop supporting life? I ask this because the habitability our species relied on for thousands of years is shifting fast.
I see clear signals: global temperatures are about 1.1°C above pre-industrial levels, and many areas already cross habitability thresholds. Roughly 600 million people live beyond comfortable temperature ranges now, and heat and drying trends push livelihoods, health, and safety. Lake Chad’s long shrinkage shows how reduced supply forces communities to relocate year after year.
In this report I map where people are moving, why they move, and what options exist. I combine data-driven findings with real-world cases and U.S. signals like FEMA buyouts and market stress. Read on and I will lay out which areas face the greatest risks in the next years and what leaders can do now.
Key Takeaways
- Rising temperatures and resource loss are already changing habitability for millions.
- Some regions show clear patterns of relocation tied to shrinking supplies.
- I use data and case studies, like Lake Chad, to separate fast disasters from slow decline.
- The U.S. displays unique signs—insurance stress and early relocation programs—that matter for planning.
- Equity matters: the poorest often lack options when places no longer sustain them.
- Learn more about global challenges in access at global challenges.
Executive snapshot: What I’m seeing now, and what could change by 2050
I track a handful of strong signals that point to near-term shifts in where people live and how communities cope. Rising extreme events, insurance market stress, and seasonal resource shortfalls already show up in my data.
Key present-day signals in the United States and globally
Global disasters rose roughly fivefold from 1970 to 2019, causing about $4.3 trillion in losses and over two million deaths. Two-thirds of the world now faces severe seasonal water scarcity at least one month a year.
In the U.S., roughly 3.2 million people moved over two decades to escape rising flood risk. FEMA buyouts and insurer pullbacks in at least 18 states show markets are reacting now.
What the data implies about near-term shifts in people and places
- More frequent events and market signals make short-distance moves likeliest at first.
- Insurance rate spikes and coverage loss can accelerate relocations before long-term planning starts.
- IPCC warnings and current heat levels suggest some countries will face habitability limits within years, not decades.
My report uses these indicators to map where pressure will grow by 2050 and which actions can still reduce forced moves.
Defining the trend: From displacement to migration in a warming world
I examine how abrupt disasters and slow environmental decline create distinct routes from displacement into migration.
The IPCC states with high confidence that climate hazards are an increasing driver of involuntary moves. The Internal Displacement Monitoring Centre records millions of internal displacements each year, and floods and storms make up most cases.
I use “displacement” for forced, rapid moves after a disaster and “migration” for slower, strategic relocation after prolonged climate change pressures.
Floods and storms usually cause short, nearby evacuations. Droughts and groundwater decline can push families over years toward permanent relocation. I show one common pathway: repeated flood displacement erodes savings until rebuilding is no longer viable, and a permanent move follows.
- Movement often stays internal; people move the shortest distance first.
- Repeated displacements raise costs and vulnerability when recovery aid lags.
- Slow, compounding change can reach tipping points that convert seasonal mobility into permanent relocation.
Data gaps on cross-border moves make precise counts hard. In the next section I map the ecological and economic thresholds that turn chronic stress into lasting decisions about where people live.
Human habitability is shifting: How climate stability gave way to new risks
Stable weather patterns that shaped cities and farms for millennia are breaking down, shifting where people can safely live.
The “human climate niche” and thresholds that push people to move
Humans have clustered where annual temperatures averaged about 11–15°C, with a tropical band near 20–25°C. Those bands supported dense population centers, agriculture, and long-term land use and development.
Today the global average is roughly 1.1°C higher. I track a stark fact: roughly 600 million people now live beyond a ~29°C upper niche threshold. If warming reaches about 2.7°C, nearly one-third of the population could fall outside the niche.
- Rising levels push people toward physiological and economic limits, raising health and livelihood impacts.
- Two-thirds of people already face at least one month a year of severe water shortage, and sea level has risen ~0.2 m — coastal exposure will affect over a billion by 2050.
- Where services and investment cannot offset heat and resource stress, migration becomes more likely.
These thresholds give clear planning signals: invest in protection where feasible, upgrade systems where effective, or begin fair relocation planning where risks are entrenched. In short, freshwater reliability and population density will shape which places adapt and which places transform in the years ahead.
climate migration due to water scarcity
When taps run low and wells fall silent, families face immediate choices about health, income, and whether they can stay. I focus here on how freshwater access underpins daily life and why its loss often triggers mobility pressures.
Why freshwater access underpins health, agriculture, and livelihoods
Safe supply supports drinking, sanitation, hygiene, and clinic operations. Without it, illness rises and productivity falls.
Farms need reliable sources for crops and livestock. Even short seasonal deficits cut yields, push up food prices, and reduce local earnings.
How droughts and groundwater depletion escalate mobility pressures
Repeated dry seasons and falling aquifers force farmers to change crops or abandon fields. Wage shocks follow and households look for alternative work.
In countries with weak safety nets, these stresses widen out into larger moves as people search for stable income in towns or across borders.
When “immobility” becomes the hidden risk for the most vulnerable
Not everyone can leave. Costs, lack of documents, and limited networks keep some people trapped even as resources run out.
That immobility deepens inequality: lost productivity, stalled development, and eroded local services create a feedback loop that worsens stress before migration rises.
- I link these dynamics to SDGs that cover water, production, climate, land, and inequality.
- Targeted investments in infrastructure and demand management can reduce forced moves if started early.
Mechanisms: How water scarcity triggers migration decisions
I map the step-by-step process that turns crop and livestock failures into choices about moving. Small shocks stack: a failed harvest, lost wages, and closed clinics all cut options for households.
Crop and livestock failures, wage shocks, and lost services
More than one-third of crop and livestock losses in low- and middle-income countries come from droughts. Extreme events and pests can wipe out yields and local jobs.
When earnings fall, people lose access to basic services like schools and clinics. That gap pushes seasonal moves as a short-term strategy.
Conflict risks and social stress where resources run low
Resource pressure raises tensions over land and grazing. Violence and unrest have followed resource shortfalls in some regions.
Social stress makes households weigh leaving against staying, and networks of earlier migrants often shape where they go.
Threshold events: From seasonal moves to permanent relocation
Thresholds matter: a failed harvest, a school closure, or repeated disasters can change coping into a plan to relocate. Moves usually start short and local.
- I show how repeated shocks deplete savings and push seasonal travel toward permanent relocation.
- Not all people can leave; immobility traps the poorest and raises equity concerns.
- Better services and local jobs can delay or reduce migration if action arrives early.
Global hotspots I’m tracking right now
I watch a handful of global hotspots where shrinking supplies and rising stresses are already shifting how people live. Each area follows a different path from resource pressure to movement, and together they show what leaders should watch.
Sahel and Horn of Africa
Altered rainfall patterns are reducing yields and pushing rural households toward towns. Loss of reliable rains harms farming and grazing. I see more short moves as people seek work and services in nearby cities.
South and Central America
In countries like Honduras, Nicaragua, and El Salvador, prolonged droughts have eroded farm incomes. Rural departures rise as families seek urban jobs or cross borders for safety and work.
South and Southeast Asia
Salinization of rice paddies, groundwater decline, and monsoon shifts shrink freshwater storage and lower yields. Many households switch livelihoods or relocate within river basins and coastal areas.
Small island states
Sea-level rise—about 0.2 m so far—and storm surges are contaminating freshwater lenses. Internal moves are common as communities protect health and access to clean supplies.
| Hotspot | Main stress | Typical moves |
|---|---|---|
| Sahel & Horn | Altered rainfall, land degradation | Rural → nearby urban centers |
| South & Central America | Extended droughts, crop loss | Rural → cities or cross-border |
| South & Southeast Asia | Salinization, storage loss | Local relocation, livelihood shifts |
| Small islands | Salt intrusion, storm impacts | Internal resettlement |
Two-thirds of people face at least one month a year of severe stress. I track how migrants first move short distances, straining services in receiving areas. Better water management and livelihood options can slow forced moves. For a deeper global context, see how climate change fuels global water.
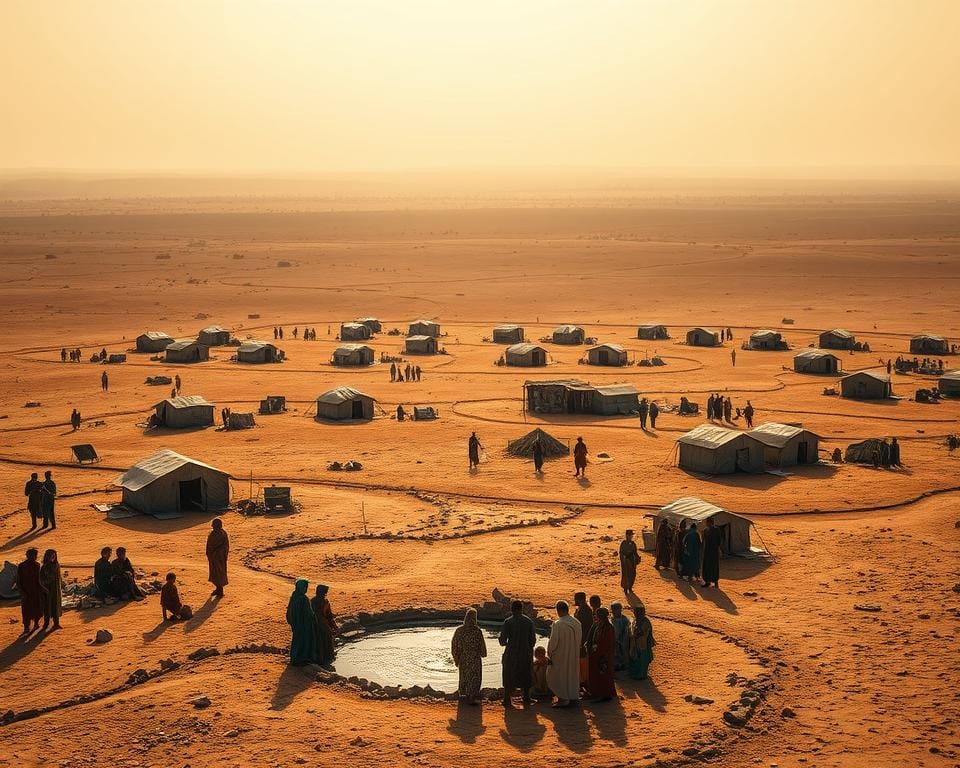
Case signal: Lake Chad’s decades-long shrinkage and annual moves
The Lake Chad basin offers a clear example of progressive mobility I track closely. The lake once supported over 30 million people across several countries, and its retreat over many years has forced repeated shifts in local life.
What long-term field evidence reveals about progressive mobility
Fieldwork by Amali Tower (Climate Refugees) documents communities moving annually since at least 1973. Most moves stay within nearby regions and often repeat across years as shorelines change.
- I show how a mix of climate impacts and rising human water use drives steady change in livelihoods.
- The number of moves per household adds up, raising costs and vulnerability for many people.
- Monitoring is improving, but cross-border data on migrants remain sparse.
| Driver | Effect | Local response |
|---|---|---|
| Less rainfall & more withdrawals | Short moves, lost income | Seasonal relocation, new jobs |
| Long-term retreat | Service strain, repeated moves | Community coping, calls for investment |
I use Lake Chad as a cautionary example. Targeted, region-specific investments could stabilize towns and reduce forced migration if acted on in the years ahead.
Inside the numbers: Disasters, displacement, and data gaps
Numbers tell a sharper story: reported disasters grew fivefold from 1970–2019, producing over 2 million deaths and roughly $4.3 trillion in damages. I use those figures to show how sudden events shape recorded moves and policy attention.
Floods and storms drive most documented internal displacement. The IDMC recorded 32+ million climate-linked internal displacements in 2022, largely in Asia-Pacific. One event — Pakistan’s 2022 floods, which hit 33+ million people — made up about a quarter of that year’s total.
Floods and storms dominate recorded internal displacements
Rapid weather events are easier to count. Emergency response logs, shelter records, and media reports capture large, short-term moves. Canada’s 2023 wildfires, for example, displaced over 100,000 people and show how fast populations can shift.
Why cross-border movement is hard to quantify
Cross-border flows blend drivers, legal categories, and mixed records. Countries track arrivals differently, and slow-onset stress often slips under migration monitoring. That creates a bias: sudden events appear larger in datasets than long-term land degradation or slow decline.
| Driver | Recorded impact | Where data are strong | Key gaps |
|---|---|---|---|
| Floods & storms | High short-term displacement; clear counts | Emergency shelters, media, IDMC | Repeat moves and long-term return rates |
| Wildfires & heat events | Large local evacuations | Evacuation logs, insurance claims | Cross-border follow-up and secondary moves |
| Slow-onset land loss | Gradual livelihood decline | Local surveys, case studies | National harmonized tracking and international counts |
I note three practical implications: first, reported numbers underrepresent slow shifts; second, repeated displacements over years complicate true counts; and third, planners must map service capacity in receiving areas. These points prepare us for U.S.-specific signals that mirror global patterns.
The U.S. outlook: Where water scarcity and heat could move people
I track clear signals that different regions will face distinct pressures in the years ahead. Tens of millions could move this century, though studies vary and uncertainty remains.
South and Southwest: Extreme heat, drought, and wildfire risk
The South and Southwest face rising heat indexes and more frequent droughts. Mid-century heat indices may top 130°F in some areas, stressing health and jobs.
Insurer exits and higher premiums already push some households to consider leaving. Local policies on cooling, storage, and wildfire management will shape whether people can stay.
Coasts: Sea-level rise, flood buyouts, and retreat dynamics
Sea level may rise 1–2 feet along the Gulf and East Coasts by 2050. FEMA buyouts are expanding where floods recur, nudging retreat in high-risk neighborhoods.
Buyouts and zoning choices will guide where communities downsize, and where new development is allowed. That process often sets migration paths years before large moves occur.
Great Lakes and the North: Emerging “climate havens” with water access
Northern cities and Great Lakes towns highlight freshwater advantages and lower heat exposure. These areas may attract people leaving hotter or drier places.
Policies that expand housing, services, and resilient infrastructure will determine if hosts can absorb newcomers fairly and safely.
| Region | Key risks | Likely moves | Policy signals |
|---|---|---|---|
| South & Southwest | Heat waves, drought, wildfire | Outflow to cooler cities; short-distance moves | Cooling programs, water efficiency, insurer activity |
| Gulf & East Coasts | Sea-level rise, recurrent floods | Buyouts; planned retreat or relocation | FEMA buyouts, zoning changes, coastal defenses |
| Great Lakes & North | Lower heat exposure, freshwater access | In-migration; pressure on housing and services | Infrastructure investment, land-use planning |
Economics and insurance: Signals that precede migration waves
Market signals are often the earliest sign that households and lenders are rethinking where it makes sense to invest.
Insurers in at least 18 U.S. states are losing money on homeowners’ policies after a run of wildfires, floods, and windstorms. Many carriers are raising rates 50% or more or leaving markets entirely. That shift matters: when coverage becomes unaffordable, lenders restrict mortgages and buyers vanish.

The result is falling property values and the rise of stranded assets. FEMA buyouts expand where floods recur, and analysts expect market corrections as subsidies fade and pricing finally reflects real risk levels.
- I show how premium spikes and withdrawals signal that people and lenders are reassessing risk.
- I explain how unaffordable coverage reduces mortgage access and depresses home prices, creating stranded assets.
- I outline strategies for people and local governments: clearer disclosure, zoning updates, and targeted resilience action.
- I highlight examples where destructive events pushed communities from rebuilding toward buyouts and retreat.
Transparent policies and public-private partnerships can smooth this process. Clear risk signals let development follow safer paths and give people time to plan. Otherwise, abrupt market corrections can force chaotic relocation and heavy losses for households and local budgets.
Health, equity, and justice: Who moves, who can’t, and who decides
I look at who can leave, who stays, and who shapes the rules that affect both choices. Justice matters because shocks do not hit everyone the same way.
Disproportionate burdens on low-income and marginalized groups
In the United States, Black, Hispanic, and Native American communities often live in floodplains and heat-prone neighborhoods with weak groundwater access. That raises short-term risks and long-term health strains.
Many people lack savings, credit, or social networks. That immobility traps households and deepens inequality.
Ensuring frontline voices steer adaptation and relocation choices
Frontline communities must lead planning. Projects like the Resilient Coastal Communities Project in New York show how nature-based protections and inclusive design can extend benefits beyond high-value neighborhoods.
- Health monitoring and culturally competent services help both sending and receiving areas.
- Rights for migrants and targeted services reduce harms during moves.
- Funding should follow people where they live now and where they may settle next.
I argue that equity-centered adaptation and fair policies give people real choices and cut forced moves. For more on pathways and responses, see how shortage pressures are shifting populations.
Agriculture and food systems under stress
Farmers and fishers are making tougher choices as harvests and ponds fail more often.
More than one-third of crop and livestock losses in low- and middle-income countries trace back to droughts. Hot, dry seasons and extreme events cut yields and widen pest ranges, hitting farm incomes and local food supplies.
Drought-linked yield losses and aquaculture impacts
At the field level, water deficits and higher heat lower productivity for people in agriculture and aquaculture. That raises prices and deepens food insecurity across regions.
| Stress | On-farm effect | Systemic outcome |
|---|---|---|
| Droughts & heat | Yield decline; livestock losses | Higher prices; food shortages |
| Pest expansion & land loss | Lower resilience; repeat losses | Shrinking options for farming households |
| Salinity & pond warming | Aquaculture mortality; lower yields | Coastal producer income loss |
Shocks at the farm level ripple into labor markets, prompting seasonal and longer-term migration when repeated losses outpace recovery. Insurance, storage, and market access can let people ride out bad years without leaving.
- Efficient irrigation and drought-tolerant crops stabilize yields where scaled.
- Investments in storage and soil health sustain livelihoods on changing land.
- Targeted support reduces the chance that repeated shocks force permanent moves.
Governance and policy: From SDG alignment to local action
Policy choices today will shape whether communities adapt in place or face abrupt relocation tomorrow.
I align priorities with SDGs because they tie water, production, land, climate, and inequality into one policy frame. The Population Council initiative links depletion and movement with SDG 6, 12, 13, 15, and 10, and it warns that immobility risk grows where local resources are thin.
SDG links and practical priorities
I map SDG targets to clear actions: restore watersheds (SDG 6 & 15), reduce wasteful use (SDG 12), and protect vulnerable groups (SDG 10).
- Invest in equitable access and storage so households keep basic services.
- Strengthen monitoring and reporting so governments can target funds where they help most.
- Include frontline voices in design so programs last and stay fair.
What governments can do now
Federal, state, and local governments each have roles. National bodies set standards and finance programs. States translate rules and fund mid-scale projects. Cities and counties focus on services, buyout fairness, and receiving-area readiness.
| Level | Key actions | Expected outcome |
|---|---|---|
| Federal | Risk disclosure, financing, cross-country tool sharing | Clear funding paths and consistent data |
| State | Regulatory alignment, resilience grants, monitoring systems | Coordinated regional planning |
| Local | Equitable access projects, fair buyouts, receiving-area prep | Safer choices and reduced chaotic moves |
I call for transparent reporting, cross-country cooperation on efficiency and early warning, and targeted development funds. Clear policies reduce uncertainty and let communities plan, protecting both sending areas under stress and places likely to receive newcomers.
Adaptation playbook: Reducing forced moves where possible
Smart investments and fair processes let households choose whether to remain or move without crisis. I lay out practical strategies that keep people safe, protect land and support fair choices.
Water management: efficiency, storage, and demand-side practices
I recommend efficiency upgrades, leak reduction, storage expansion, and reuse systems. Smart pricing and metering curb peak demand while protecting access for vulnerable residents.
Nature-based solutions: wetlands, reefs, and watershed restoration
Restoring wetlands and reefs reduces flood risk and brings co-benefits for biodiversity and local jobs. Watershed work protects resources and stabilizes nearby areas.
Managed retreat and FEMA buyouts: designing fair processes
I argue buyouts must use transparent criteria, fair valuations, and relocation support. When retreat is safer, prompt and just action reduces harm and builds trust.
- Prioritize investments using risk, exposure, and social vulnerability metrics.
- Blend public finance, resilience bonds, and grants to scale solutions equitably.
- Coordinate communities and governments so adaptation reaches those at greatest risk first.
| Approach | Main benefit | Key action |
|---|---|---|
| Efficiency & storage | Steady supply | Leak fixes, reserves |
| Nature-based | Reduced flood damage | Wetland & reef restoration |
| Managed retreat | Long-term safety | Fair buyouts, relocation aid |
Urban and regional planning for receiving communities
Receiving regions must move from reaction to readiness if they hope to absorb new arrivals without straining services. Northern U.S. and Great Lakes cities are positioning as havens because of reliable water access and lower heat exposure.

Housing, services, and labor market capacity in haven regions
I recommend planners prioritize housing supply that can scale fast and remain affordable. New arrivals often seek nearby higher ground within the same county, so demand rises locally before long-distance moves occur.
Education, healthcare, and transit must expand alongside new housing. I urge workforce programs that align incoming skills with regional development goals. That keeps people working and reduces pressure on social services.
Data-informed zoning and resilient infrastructure investment
Use data to steer growth away from emerging risks and toward durable infrastructure. Zoning that favors denser, transit-accessible neighborhoods limits sprawl and lowers long-term costs.
- Protect affordability with inclusionary policies and targeted subsidies.
- Invest in cooling centers, transit, and upgraded water systems for long-term quality of life.
- Coordinate across agencies so housing, schools, and clinics open in step with arrivals.
- Design governance structures that include newcomers and frontline leaders in decisions.
| Need | Short-term action | Policy tool | Expected outcome |
|---|---|---|---|
| Housing | Fast-track modest multi-family permits | Inclusionary zoning, subsidies | More affordable units, less displacement |
| Services | Mobile clinics and classroom pods | Flexible funding, inter-agency task forces | Continuity of care and schooling |
| Labor market | Skill-matching programs and apprenticeships | Local job pipelines, training grants | Quick employment and local income |
| Infrastructure | Upgrade water, transit, cooling | Resilience bonds, targeted grants | Long-term stability and growth capacity |
Countries and cities that plan early cut costs and social friction later. I focus on policies that keep areas livable for current residents and new people alike while linking these steps to the broader regional resilience strategies I outline in this report.
Conclusion
The evidence I gather shows that resource risk is already reshaping where people can live and how communities respond.
Key numbers matter: disasters rose fivefold since 1970, roughly 600 million live beyond the ~29°C human niche, and two-thirds face seasonal severe shortages each year. In the U.S., about 3.2 million moved from repeated floods while FEMA buyouts and insurer exits signal shifting markets.
From Lake Chad’s repeating relocations to American buyouts, examples in this report show progressive moves and policy choices that help or harm outcomes.
I call for coordinated action across national, state, and local levels, clear market signals, and funds that reach frontline people so they can adapt in place or relocate with dignity. With timely, equitable efforts, countries can lower future risk and protect options for the next generation.